Virtual Office Software with Real-Time Team Visibility and Analytics
The SoWork Team

Published:
Updated on:
Introduction
Virtual office software with real-time team visibility and analytics solves the core coordination problem facing remote and hybrid teams: knowing who’s available, what’s happening, and where work is progressing without constant check-ins or tool hopping. These platforms aggregate all the tools teams need offering a full suite of collaboration, communication, and productivity solutions into a unified digital workspace where teams can collaborate, communicate, and maintain shared context throughout the workday.
This guide covers the essential features of virtual office platforms with integrated analytics and collaboration tools, compares leading solutions, and provides implementation strategies for remote team managers, IT leaders, and hybrid work coordinators. The focus is on platforms that reduce tool fragmentation and coordination overhead by integrating all the tools you need into a full suite, rather than adding another disconnected application to your stack. Topics like enterprise security architecture and custom development fall outside this scope. Additionally, we’ll explore how these platforms can help foster company culture in distributed teams.
Direct answer: Virtual office software with real-time analytics provides instant visibility into team presence, collaboration patterns, and productivity metrics through unified dashboards enabling managers to identify bottlenecks, optimize meeting load, improve communication, and enhance team collaboration and company culture with data-driven decisions about team coordination without invasive monitoring.
Organizations using spatial virtual offices report a reduction in meetings by up to 41%, as collaboration can happen more spontaneously. Furthermore, 2 out of 3 workers feel more productive when working remotely, highlighting the importance of effective team collaboration tools and a positive company culture in virtual environments.
By the end of this guide, you will understand:
Core visibility features including live presence indicators and spatial collaboration maps
How analytics capabilities track meeting effectiveness, communication flow, and team productivity
Detailed comparison of leading virtual office platforms and their positioning
Implementation strategies that layer virtual office foundations with existing tools
Practical approaches to common challenges including privacy concerns and analytics overload

Understanding Virtual Office Software with Team Analytics
Virtual office platforms function as AI-powered digital workspaces that sit above productivity suites like Microsoft 365 and Google Workspace to provide unified team coordination and real-time visibility. Virtual office software often categorizes into spatial hubs where users interact in a visual environment or integrated analytics layers that overlay standard productivity suites to deliver actionable insights. Rather than replacing document collaboration or project management tools, platforms like SoWork create the operational hub where distributed teams work together, communicate in real time, and stay connected throughout the day.
The relevance for remote teams is immediate: tool fragmentation forces constant context switching between chat apps, video conferencing, calendars, and project management systems. Each switch costs attention and creates coordination overhead. These tools provide a persistent digital space where users can visually see teammates moving between 'rooms' or 'focus zones.' Visual floor plans in virtual office software reduce coordination overhead by indicating who is in a 'deep work' zone or a meeting. As part of the broader virtual workplace landscape, these platforms also support virtual events to enhance team collaboration and strengthen company culture within online workspaces. Virtual office software consolidates presence, communication, and collaboration into one office experience reducing the friction that makes remote work feel disconnected from real life team interaction.
Real-Time Team Visibility Features
Live presence indicators show team availability, meeting status, and current activities by aggregating signals from integrated tools. When someone’s calendar shows a scheduled meeting, their status updates automatically. When they enter a focus block, teammates see they’re unavailable for quick conversations. SoWork implements this through calendar sync with Google Workspace and Outlook, displaying working hours, vacation indicators, and real-time availability without manual status updates.
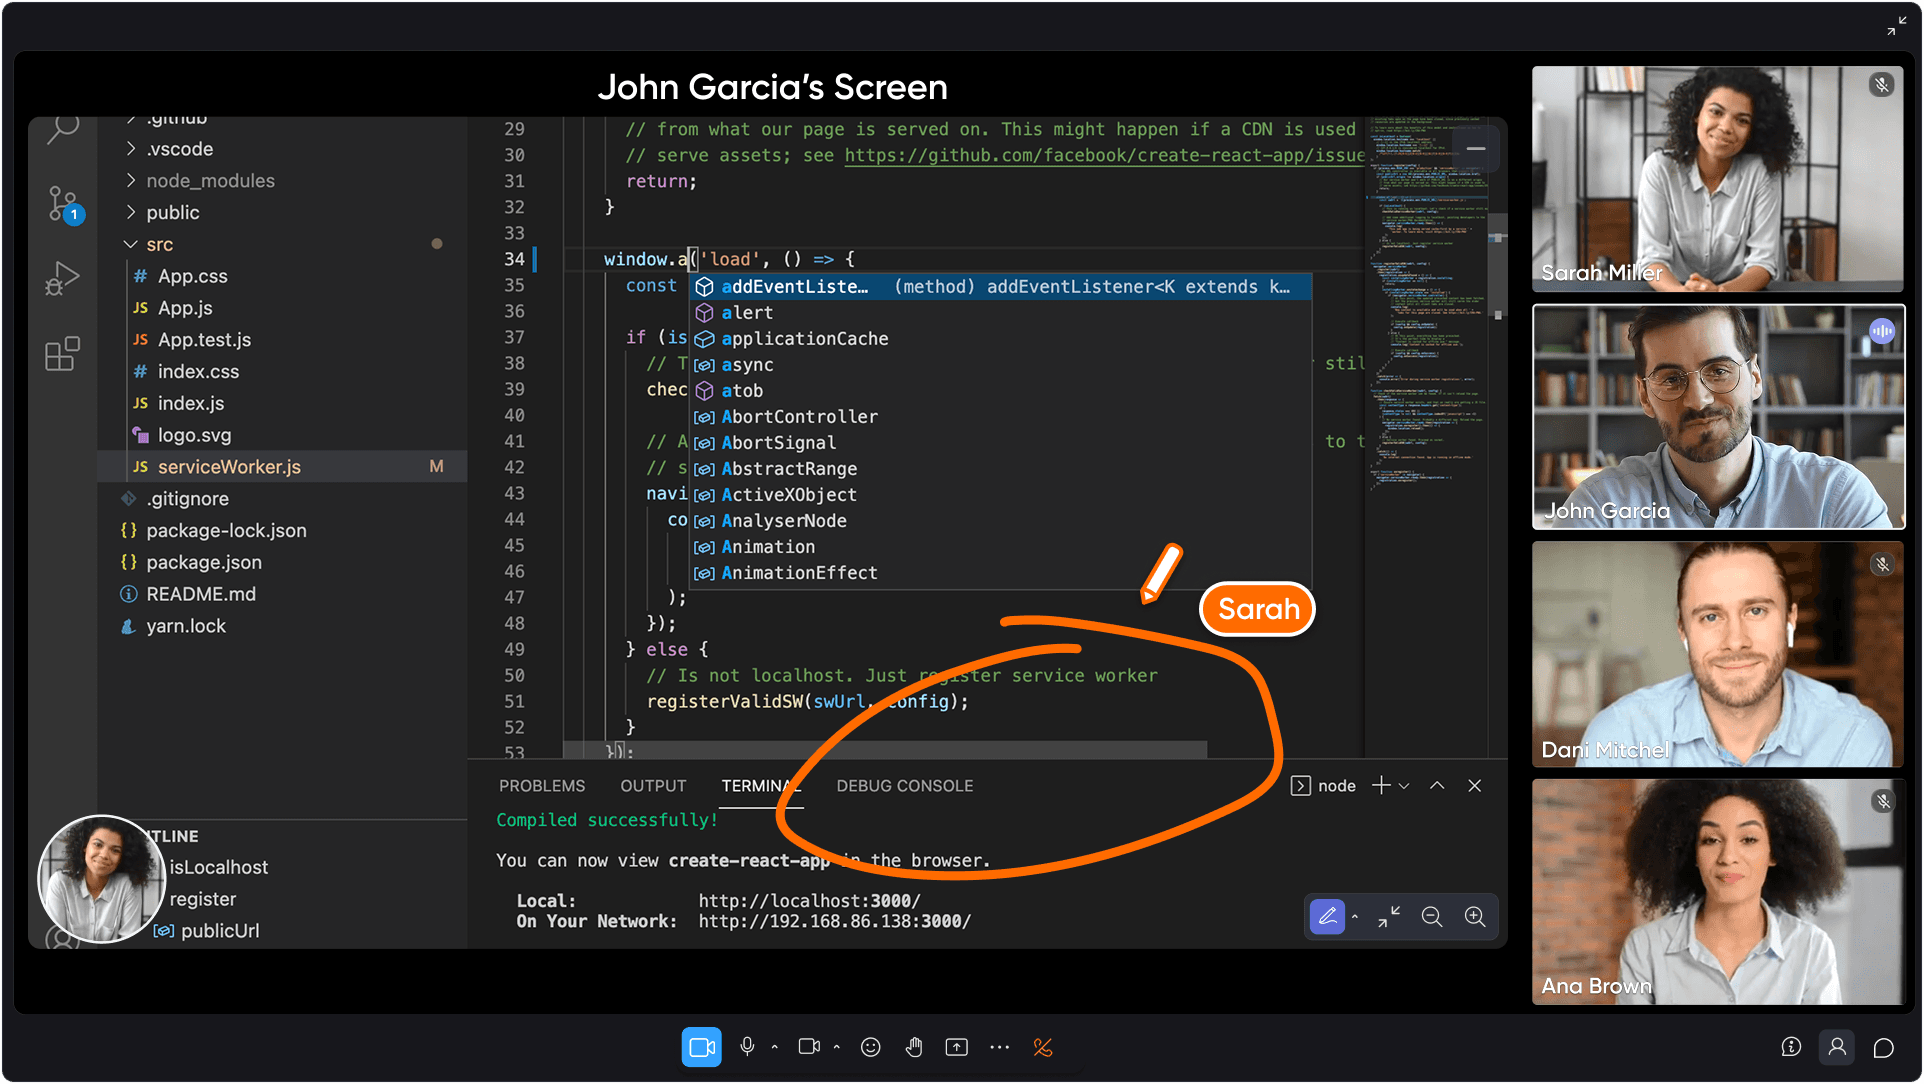
Spatial collaboration maps take visibility further by displaying team locations within a virtual workspace. Mini maps show who’s in the office, which meeting rooms are occupied, and where spontaneous conversations are happening. These tools provide a persistent digital space where users can visually see teammates moving between 'rooms' or 'focus zones.' Spontaneous collaboration allows for natural, on-the-spot conversations that speed up communication loops and reduce reliance on scheduled meetings. This mirrors the awareness you have in a physical office glancing across the room to see if a colleague is at their desk translated into the digital workspace.
Advanced real-time features like screen sharing and shared cursors further enhance collaboration by allowing teammates to interact directly on shared screens during meetings or collaborative sessions.
The connection to team productivity is direct: visibility reduces context switching by eliminating the need to check multiple tools to answer simple questions like “Is Jamie available?” or “Who’s working on the client presentation right now?” Teams respond quickly when they can see the answer rather than sending direct messages that interrupt focused work.
Analytics and Monitoring Capabilities
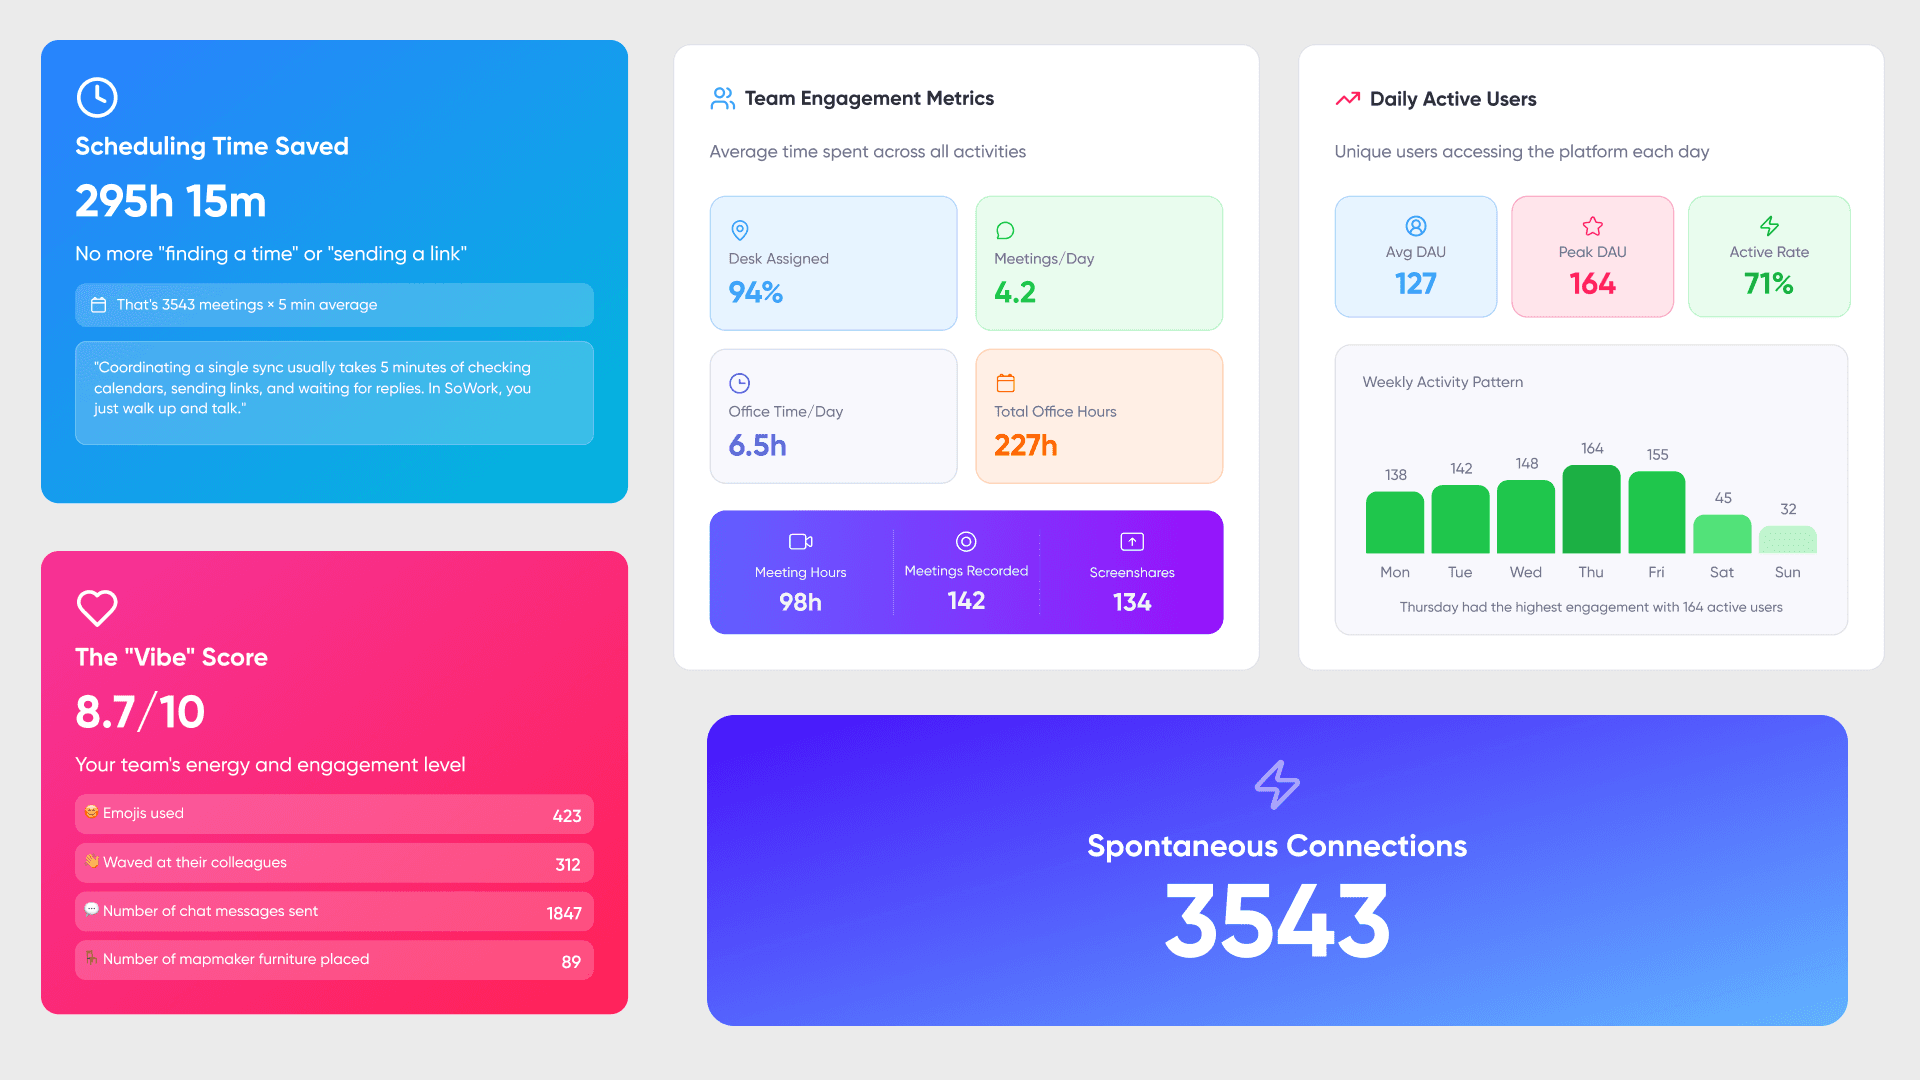
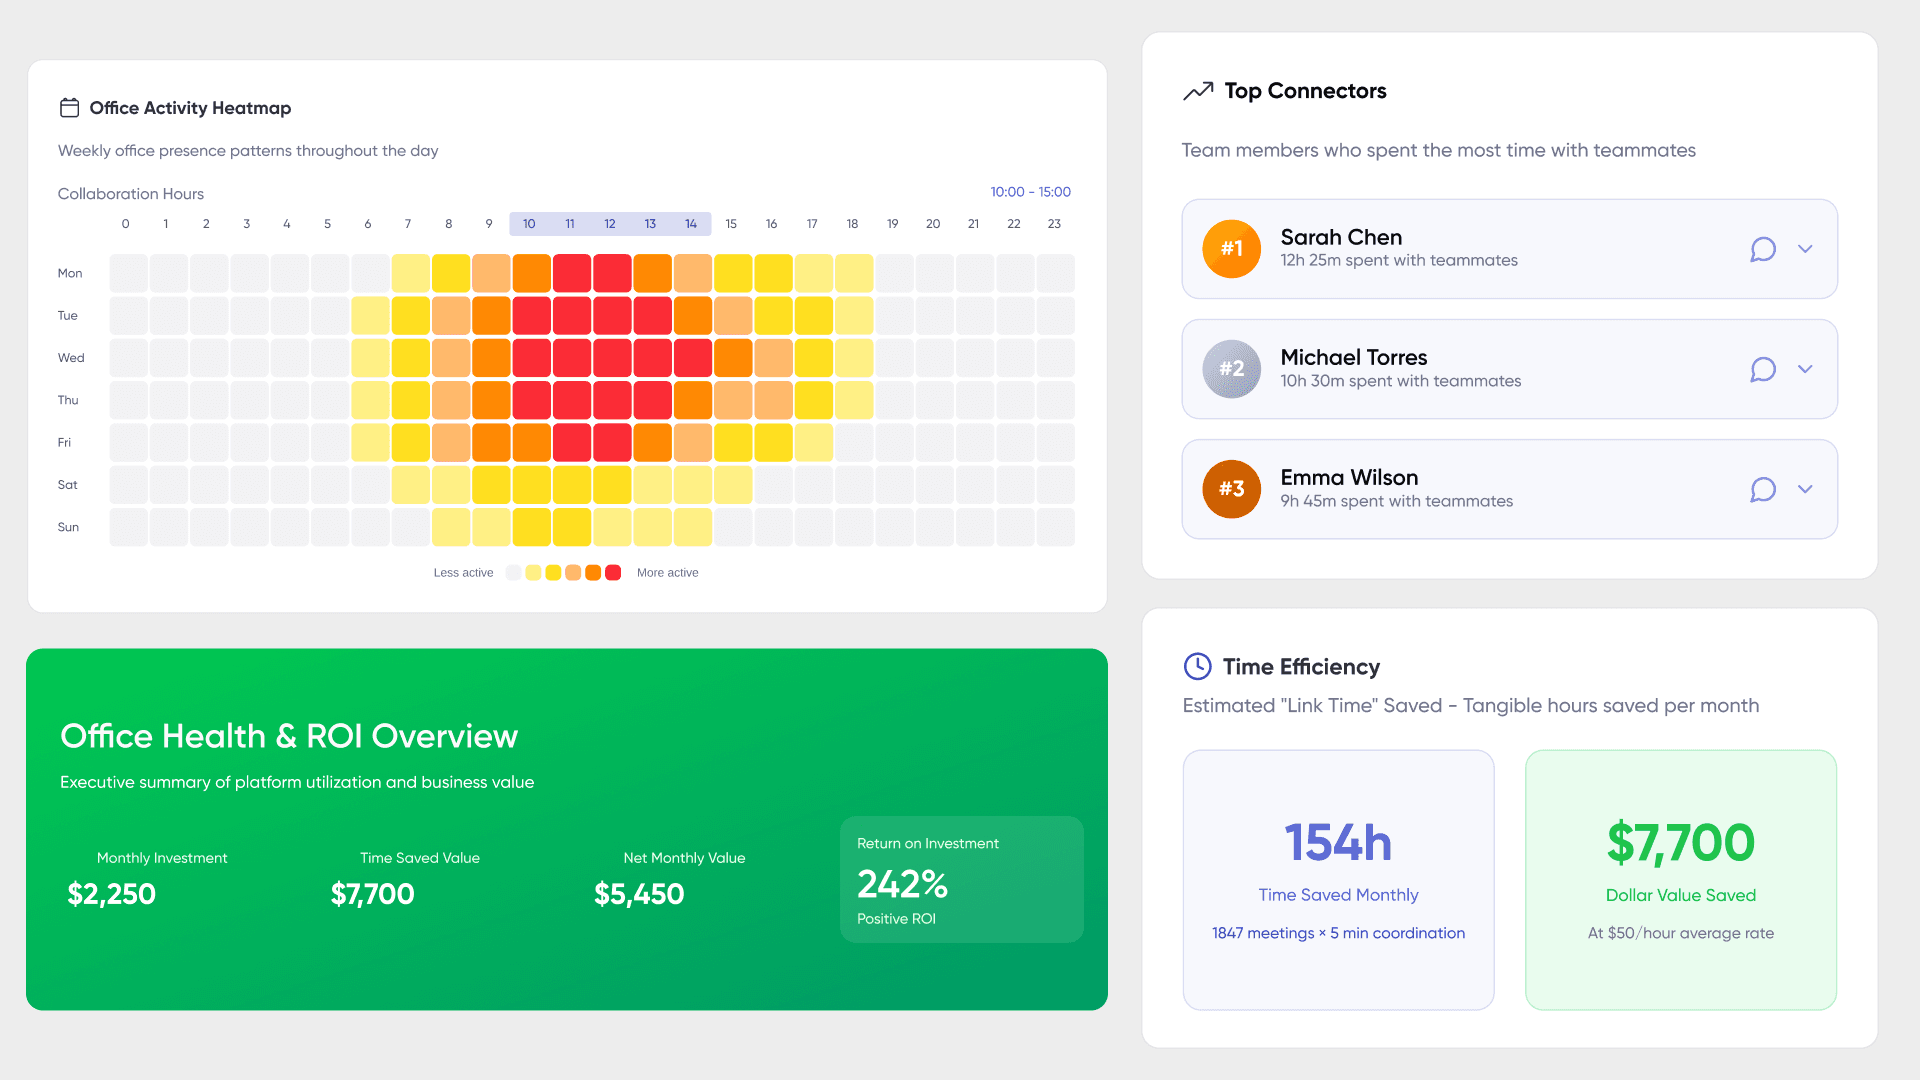
Team productivity metrics track patterns that reveal how collaboration actually happens: meeting frequency and duration, participation levels, collaboration hours overlap across time zones, and tool usage across the whole team. Team productivity trends aggregate these patterns over time, showing meeting frequency, duration, and effectiveness scores alongside tool usage analytics. SoWork’s analytics dashboards surface which meetings drive value and which represent coordination waste, enabling managers to make informed decisions about scheduling practices and supporting clear communication and effective team communication.
Communication flow analysis identifies bottlenecks before they become blockers. Real-time communication flows track response times and interaction patterns, helping managers identify bottlenecks before they cascade into delivery delays. By tracking response times, interaction networks, and connection density between team members, analytics reveal when certain individuals are overburdened, when teams are siloed, or when communication patterns suggest disengagement. Microsoft Viva Workplace Analytics offers similar capabilities through passive workplace data from emails, chats, and meetings.
The relationship between visibility and analytics creates a feedback loop: real-time presence data feeds historical analysis, which then improves coordination decisions. Seeing that two team members rarely interact despite working on related projects suggests a connection problem that visibility tools can help address through intentional collaboration.
Understanding these foundations prepares teams to evaluate specific analytics features and choose implementation approaches aligned with their coordination needs.
Core Analytics Features and Implementation
Building on the visibility foundation, core analytics features transform raw presence data into actionable insights about team coordination, meeting effectiveness, and productivity patterns. These analytics capabilities give IT leaders and managers more control and full control over team coordination and data access, ensuring operational integrity and security. Additionally, dedicated support is available to assist with implementation and ongoing operations, helping organizations accelerate onboarding and optimize their digital workspace environments.
Presence Tracking and Activity Monitoring
Real-time status aggregation pulls availability signals from calendar platforms, communication tools, and the virtual office itself. When a team member joins a video call, enters a breakout room, or blocks focus time, their presence updates across all integrated systems. This requires technical integration with existing tools calendar APIs from Google Calendar and Outlook, status sync with Slack or Microsoft Teams, and detection of activity within the virtual workspace.
Implementation methods vary by platform. SoWork provides native integrations with major productivity suites and uses Zapier for extended workflow automation. The key distinction from surveillance-oriented monitoring: presence tracking aggregates status signals rather than logging keystrokes or screen contents. Privacy-compliant approaches emphasize team-level insights over individual surveillance, with tools like Google Workspace Work Insights requiring minimum team sizes of 10+ before displaying data to prevent singling out individuals.
SoWork’s AI-powered presence detection combines these signals into unified dashboards showing the whole company’s availability at a glance the “What’s Happening” tab that answers coordination questions without interrupting anyone’s focused work. These dashboards integrate all the tools teams use, providing a comprehensive view and reducing the need to switch between fragmented apps.
Communication and Collaboration Analytics
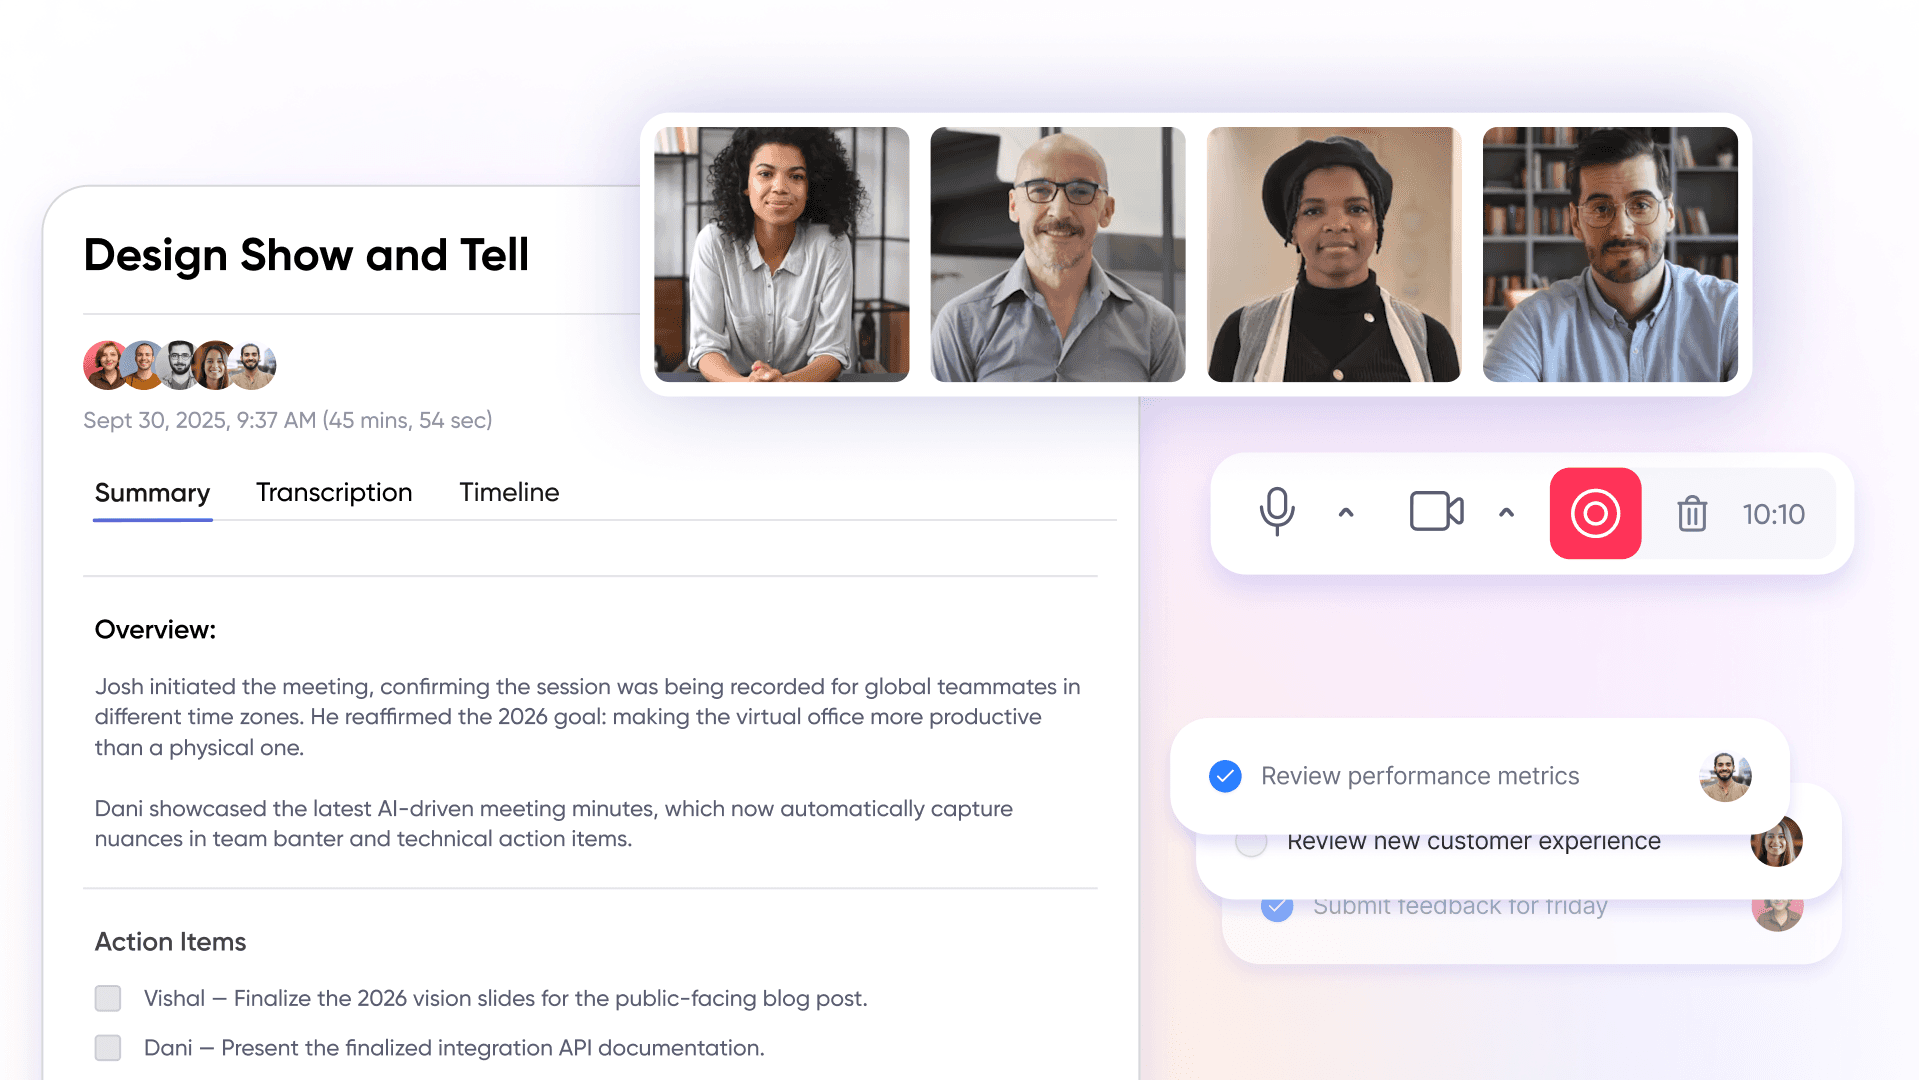
Meeting effectiveness scoring evaluates whether scheduled meetings drive outcomes or drain productivity. Metrics include attendance patterns, duration relative to agenda, participation distribution, and action item completion. SoWork’s Meeting Summary uses AI to extract action items and create searchable records, enabling teams to assess meeting value over time rather than relying on subjective impressions.
Cross-team interaction patterns reveal collaboration network density who talks to whom, which teams connect seamlessly, and where communication gaps suggest coordination problems. Collaboration tools are essential for enabling and measuring team collaboration across departments, as they facilitate document sharing, communication, and teamwork. Decision-making velocity tracks how long items remain open between discussion and execution, identifying where dependencies create delays.
These communication analytics connect directly to presence tracking: understanding when people are available enables better scheduling, while interaction analysis reveals whether availability translates into actual collaboration.
Productivity and Performance Metrics
Focus time analysis measures blocks without meetings or interruptions the deep work periods that produce meaningful output. Context switching measurement quantifies how often team members move between tools, chats, and meetings within work sessions. High switching rates correlate with reduced productivity and increased cognitive load.
Workflow continuity tracking integrates with project management tools to show project progress alongside team coordination data. Integrating with more apps such as Microsoft Teams, Discord, Element, and Google Workspace alongside a full suite of productivity and communication tools, provides comprehensive analytics coverage. SoWork’s integrations via Zapier connect action items from meetings to task systems, maintaining visibility from discussion through completion.
Team alignment indicators show overlap in working hours across time zones, collaboration hours when most team members are available, and progress toward shared goals. For distributed teams spanning multiple regions, these metrics inform decisions about core hours, meeting timing, and asynchronous versus synchronous communication balance.
With these analytics capabilities understood, evaluating specific platforms requires examining how each implements these features within their broader product positioning.
Leading Virtual Office Platforms Detailed Analysis
Choosing virtual office software requires understanding how different platforms approach the visibility and analytics problem some, like Tandem, are considered a game changer for remote and hybrid team communication, thanks to the innovative vision of their co-founders who have shaped these solutions as dedicated virtual workspace platforms. Others serve as analytics layers within existing productivity ecosystems.
Platform Categories and Positioning
Virtual office hub platforms like SoWork, Sococo, and Kumospace create spatial digital workspaces where teams gather, collaborate, and maintain presence throughout the workday. These platforms serve as a virtual workplace, providing a centralized environment that fosters team collaboration and team communication, setting them apart from basic document suites and specialized tools. They act as the operational hub where work coordination happens before people open individual applications.
SoWork positions itself as an AI-powered virtual office foundation with universal integrations the place where remote and hybrid teams start their workday, see who’s available, drop in for spontaneous collaboration, and maintain the same room awareness that physical offices provide naturally. Its emphasis on real-time team visibility, seamless team communication, and enhanced team collaboration distinguishes it as a comprehensive virtual workplace solution.
Microsoft Viva and Google Workspace analytics operate within existing ecosystems, providing insights derived from email, chat, calendar, and document usage. These tools excel at analyzing communication patterns for teams already committed to specific productivity suites but lack the immersive presence, spatial collaboration, and robust team collaboration features that dedicated virtual office platforms provide.
Slack Analytics and Zoom Workplace offer communication-specific insights message volumes, channel activity, meeting patterns useful for teams using these as primary communication tools but limited in cross-platform visibility and broader virtual workplace capabilities.
Specialized platforms like Worklytics focus on engineering team analytics, aggregating data from code repositories, project management systems, and communication tools for technical workflow optimization.
Feature Comparison and Capabilities
Platform | Real-Time Features | Analytics Capabilities | Integration Support | Starting Price |
SoWork | Live avatars, mini map, room status, calendar sync, vacation indicators | Team and individual analytics, meeting summaries, connection insights, collaboration hours | Full suite with robust collaboration tools; integrates with Google Calendar, Outlook, Slack, Zapier, native video/audio, and more apps | Free (up to 10 users), $6/user Basic, $15/user Premium |
Microsoft Viva | Meeting status from Teams/Outlook, collaboration hours | Deep trend analytics, sentiment surveys, cross-team network analysis, manager dashboards | Full suite for Microsoft 365; strong collaboration tools; integrates natively with Exchange, SharePoint, Teams, and more apps | ~$6/user Workplace Analytics, ~$12/user Suite |
Google Workspace Work Insights | Aggregate usage data, app adoption | Collaboration patterns, team-level trends, product adoption metrics | Collaboration tools within Google apps only (Drive, Meet, Docs, Gmail); limited integration with more apps | Enterprise licenses required |
Slack Analytics | Channel activity, presence status | Message volume, response times, workspace analytics | Collaboration tools in Slack ecosystem; limited external integration with more apps | Business+ and Enterprise plans |
Synthesis for selection: Teams needing spatial presence, a full suite of collaboration tools, and seamless integration with more apps alongside analytics should start with SoWork as the foundational layer. Organizations deeply embedded in Microsoft 365 may layer Viva analytics on top of their existing investment for a comprehensive full suite experience. Google Workspace shops can use Work Insights for adoption metrics but may want SoWork to add the presence, real-time coordination, and broader app integration that Google lacks.
Implementation Strategies
Layered approach: Start with SoWork as the virtual office foundation where the team gathers and coordinates, then add specialized analytics tools for specific needs. This creates clear boundaries SoWork handles presence, communication, and coordination while document suites handle file sharing and document collaboration. Platforms that offer dedicated support during onboarding and ongoing operations can accelerate setup and help teams optimize their digital workspace, while giving IT leaders more control over complex environments.
Ecosystem approach: For organizations committed to Microsoft 365 or Google Workspace, use suite-native analytics for what they provide (communication patterns, adoption metrics, sentiment) and overlay SoWork to add presence, spatial awareness, and spontaneous conversations that productivity suites cannot replicate.
Hybrid approach: Combine virtual office platform with dedicated analytics tools for comprehensive coverage. Use SoWork for coordination, Viva for Microsoft 365 usage insights, and specialized tools for engineering metrics or project management analytics. This requires more integration effort but provides the most complete visibility, especially when platforms offer dedicated support and more control to sustain operational excellence.
Free trial options: SoWork’s free plan supports up to 10 members for initial testing. Upgrading to Basic ($6/user/month) adds unlimited members and video capabilities. Premium ($15/user/month) unlocks full analytics dashboards and AI summaries. Microsoft Viva requires appropriate licensing within existing 365 subscriptions. Google Work Insights requires Enterprise tier accounts.
Common Challenges and Solutions
Implementing virtual office software with analytics capabilities creates predictable obstacles, especially when remote teams strive to maintain company culture and strengthen relationships. Addressing these challenges proactively improves adoption and outcomes. Celebrating milestones and team wins within the virtual office can strengthen company culture and enhance employee engagement. Additionally, creating opportunities for informal interactions such as virtual 'watercooler moments' helps build camaraderie and cohesion among remote teams. Leveraging co-working features, like shared digital spaces or collaborative activities, can further foster collaboration and team spirit.
Data Fragmentation and Integration Complexity
Data scattered across calendars, chat platforms, video conferencing, and project management systems makes unified visibility difficult. The solution focuses on platforms with native integrations SoWork connects calendars and chat tools directly, providing one dashboard view rather than requiring manual data consolidation. For custom analytics requirements, API consolidation through middleware like Zapier creates automated flows between tools without building custom integrations.
Privacy Concerns and Employee Monitoring
The line between visibility and surveillance determines whether teams trust analytics tools. Transparent policies emphasizing team-level insights over individual tracking maintain that trust. Aggregation thresholds (like Google’s 10+ person minimum) prevent singling out individuals. SoWork’s approach tracking presence and participation rather than keystrokes or screen contents models non-invasive monitoring that supports coordination without surveillance.
Communication matters: explain which metrics are collected, who can access them, and how they inform decisions. Allow privacy settings where possible and avoid collecting sensitive data without explicit consent.
Analytics Overload and Decision Paralysis
With dozens of possible metrics available, teams can drown in data without gaining actionable insights. The solution: start with 3-5 core metrics aligned with specific coordination goals. Meeting cost (hours × attendees), collaboration hours overlap, participation rates, and connection density provide meaningful signal without overwhelming dashboards.
AI-powered insights help here SoWork’s summaries and Viva’s recommendations surface the most important patterns rather than requiring managers to analyze raw data. Regular reviews (weekly or monthly) determine which metrics drive decisions and which can be retired.
Tool Stack Complexity and Adoption Resistance
Adding new tools to already complex stacks creates resistance and poor adoption. Gradual implementation starting with the virtual office foundation before adding specialized analytics reduces overwhelm. Position SoWork as the place where work starts the first application opened each day rather than another tool to check periodically.
Training strategies matter: show teams how status sync works, what presence indicators mean, and how spontaneous conversations happen in virtual spaces. Create overlap blocks when everyone is expected in the virtual office to demonstrate value through experience rather than explanation.
These challenges become manageable when teams approach virtual office implementation as strategic foundation-building rather than tool addition.
Conclusion and Next Steps
Virtual office software with real-time visibility and analytics serves as the strategic foundation for remote team coordination not another tool in the stack, but the layer where teams gather, communicate, and maintain the shared context that makes remote collaboration work. Platforms like SoWork reduce tool fragmentation and coordination overhead by consolidating presence, communication, and collaboration into a unified digital workspace that sits above document suites and specialized applications.
Immediate actionable steps:
Audit your current tool stack to identify visibility gaps—where do coordination questions require checking multiple applications?
Trial SoWork’s free plan for up to 10 users to experience spatial presence and integrated analytics
Establish baseline metrics for meeting load, collaboration hours, and response times before implementation
Define 3-5 core analytics metrics aligned with your team’s specific coordination challenges
Plan gradual rollout starting with the virtual office foundation before adding specialized analytics layers
Related topics to explore: Advanced integrations for complex tool stacks, custom analytics development for organization-specific metrics, and enterprise security considerations for regulated industries each build on the foundation covered here.
Additional Resources
SoWork free trial signup with premium plan comparison ($6-15 per user monthly)
Integration guides for Google Workspace, Microsoft 365, Slack, and Zapier workflows
Team visibility assessment checklist: presence indicators, analytics depth, integration requirements, privacy controls
ROI calculation framework: meeting time reduction, coordination overhead decrease, response time improvement
Blogs
Read Similar Articles

Remote Team Analytics: Complete Guide to Data-Driven Remote Work Management in 2026

Complete Guide to Gaining Visibility Into Remote Team Performance and Collaboration
